


Fires one year; huge amounts of snow the next. You never know what Mother Nature is going to throw our way. I’ve never spent as much time immersed in fire data trying to figure out where smoke-free backpacking routes might be as I have the past few years. If the predictions of experts hold true, we’ll be doing a lot more of that in the future as our fire season spreads across the calendar. I now have a set of go-to websites where I cross-reference wildfire activity and air quality.
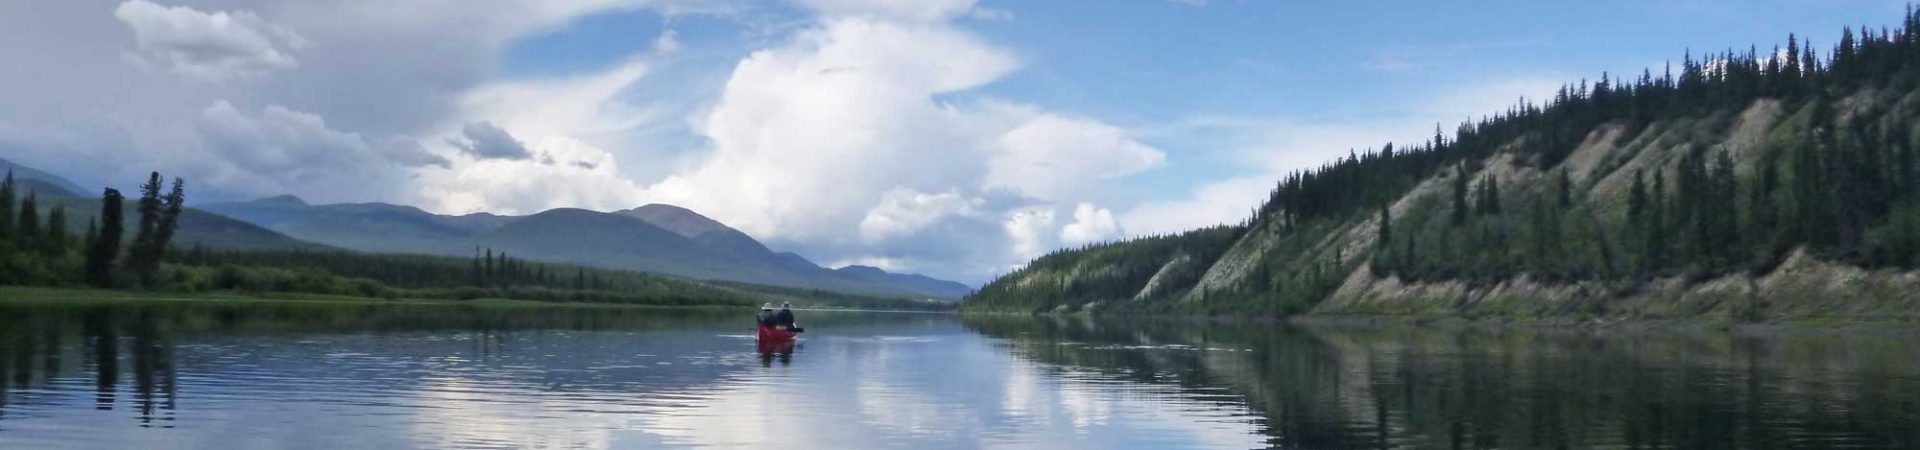
Smoke from the Carr Fire hangs over Juniper Lake, Lassen Volcanic National Park
To put fires into context, it is important to understand that wildfires have always been a part of the California ecology. Fire plays an important role in maintaining healthy ecosysytems but can also cause great harm. In the past, fall saw destructive fires from the so-called Santa Ana (in Southern California) or Diablo (in Northern California) winds—hot dry winds that reverse direction from the usual marine flow and blow from the dry Central Valley to the west, often leaving a path of burned destruction in their wake. I now live in a Diablo wind-generated burn zone in Sonoma. The Wine Country Fires (LNU Complex) started on October 8, 2017 and burned 110,000 acres and 6,957 structures in Sonoma and Napa Counties. Forty-two people died in Northern California fires (22 in Sonoma alone) that year. Since then, huge fires have become the norm and records fall with terrifying regularity.
That doesn’t mean summer doesn’t usually see significant wildfire activity, especially with California’s normal cycles of multi-year droughts alternating with wet years. Summer wildfires usually burn more slowly and a “let burn” policy in rugged, wild terrain has been in place for decades. Santa Ana/Diablo fires, on the other hand, can burn quickly and be more destructive as they burn through developed areas along the coast (e.g. Wine Country fires, Oakland fire, Cedar Fire, Laguna Beach Fire). To add another word to our growing vocabulary, a foehn wind is a dry, warm, down-slope wind that occurs on the downwind side of a mountain range.
Both summer and Santa Ana/Diablo fires have been increasing in number and severity as California gradually gets warmer and drier. Summer fires generally burn between June and September while Santa Ana/Diablo fires can occur in October or later. We’re beginning to understand that destructive fires can occur at any time throughout the year.
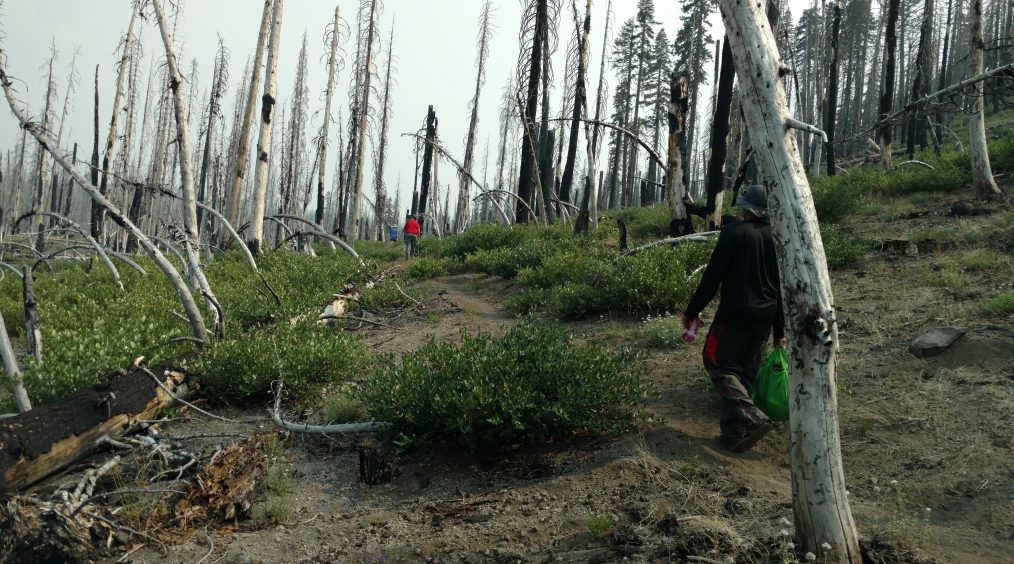
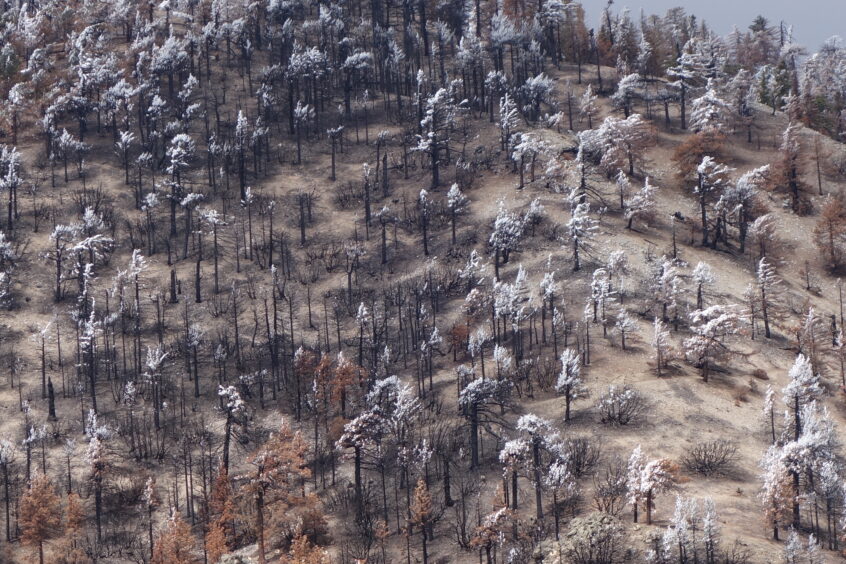
Hiking through a burn zone from the Reading Fire (2012) near Feather Lake with smoke from the Carr Fire (2018), Lassen Volcanic National Park
There are many websites that aid in tracking fires and their aftermath. The ones that I used the most are listed below. I shared these on hiking forums over and over in 2018 as hikers scrambled to develop Plan B, Plan C or were forced to cancel their plans, some of which were in the making for over a year. Many John Muir Trail and Pacific Crest Trail hikers had to figure out alternate trailheads and exits while contending with the effects of smoke. Some lucked out and found slices of clear air while others left the trail, worried about the health effects of breathing particulate matter or being caught in the path of a fire.
TrailInfo.org. You can get updates about fires and air quality within 50 miles of your location by texting your GPS coordiates on your satellite messenger device (Garmin InReach, Zoleo, SPOT) to (765) 55-FIRES (that’s 765-553-4737). See TrailInfo.org for more information on how this works.
Webcams are useful for visualizing the sky in real time. This is useful when evaluating smoke and identifying fire activity. This is a sample and webcams are being added all the time.
Being able to identify the perimeter of previous burn zones is valuable when planning a route. Walking through short segments of burn zones can be educational and interesting but if most of your planned route is in a scorched area, it can be unappealing. Entering Burn Area: Yosemite After the Fire, a New York Times article, describes a hike through a burn zone.
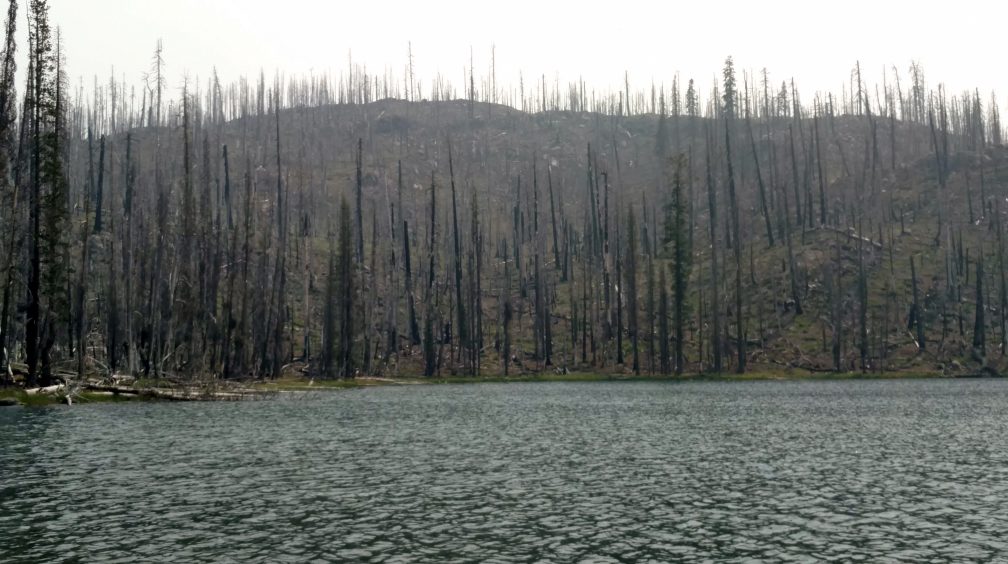
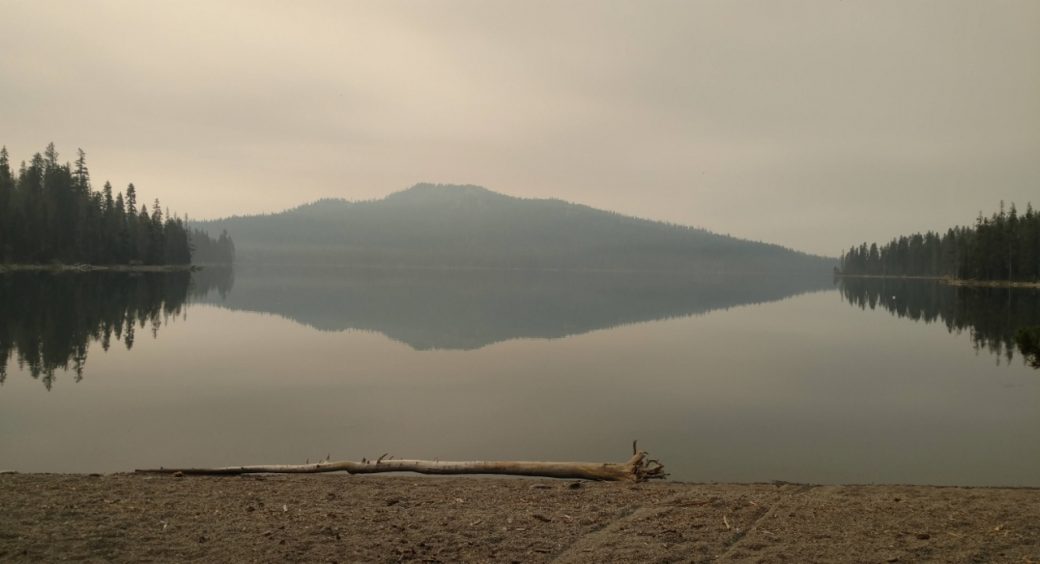
Feather Lake after the Reading Fire (2012) with smoke from the Carr Fire (2018), Lassen Volcanic National Park
I have become increasingly concerned about the effects of hiking in smoky conditions. The fine particles (PM2.5) are the biggest problem. Burning eyes, a runny nose, cough, phlegm, wheezing or difficulty breathing are symptoms that can result from breathing fine particles. Those with heart or lung problems can be impacted even more.
A comprehensive review of the health effects is beyond the scope of this article but several links are provided for those who are curious. Common sense would indicate that engaging in activity that requires deep inhalation of particulate matter into the far recesses of the lung and having 24-hour exposure is not a good idea. To briefly summarize the data in the references below, smoke is not good for your health.
Face masks can provide some protection. A simple dust mask is not adequate. N95 masks are recommended as they filter 99% of airborne particles. The mask must fit properly and snugly to be effective. The CDC offers an illustration about how to wear masks. The N95 masks can be worn for at least 8 hours, according to the CDC, perhaps longer depending on the circumstances. Hiking for an extended period of time would not be comfortable but with the increasing incidence of fires, adding an N95 mask to your emergency kit may be prudent. Reusable N95-N99 masks are available (see Cambridge Mask, technical specs here), which may be more practical to pack. My favorite disposable masks are Powecon KN95 masks from Bonafide.

Powecon KN95 mask by Bonafide
A more acute concern if you’re on the trail in the vicinity of a wildfire is safety. Fires can move quickly and move faster when moving uphill than downhill. Avoid being on a ridge with a rapidly approaching fire from below. Watch the sky and assess the velocity and direction of smoke, talk to other people on the trail, share information and obey closure notices and any instructions from officials. Leave your itinerary with rangers, friends and in your vehicle at the trailhead. If you have a satellite communication device with two-way communication, use it to get up-to-date information. Officials have various ways of communicating with backcountry travelers and I have seen several reports of air evacuations (though of course, there is no guarantee that resources will be available or that weather or fire conditions will cooperate). Don’t do anything that would put personnel at risk such as ignoring closure signs or getting caught in a fire zone when you could reasonably avoid it.
The Pacific Crest Trail Association (PCTA) has three informative articles
Finally, I would be remiss if I didn’t address prevention of forest fires. Though lightning strikes can and do cause wildfires (e.g. Rough Fire, 2015, 257,314 acres burned in Sequoia Kings Canyon NP), the vast majority are caused by humans. The Rim Fire in 2013 was caused by an illegal campfire. The Carr Fire was caused by sparks resulting from a flat tire (the tire rim scraped the asphalt and threw off sparks). The Ferguson Fire in Yosemite was caused by a faulty catalytic converter in a passing vehicle.
The first recommendation is to not build campfires. Period (sort of–the only exception would be if it’s cold and wet and someone has hypothermia). We stopped building campfires years ago because we were so afraid of what wildfires were doing to our state and now we just don’t think about them anymore. It makes sense to urge caution when using stoves but I rarely hear about major fires being started by stove use.
Fire Information, PCTA
Though wildfires have always played a role in California ecology, we can expect stronger and more frequent fires. By using available resources and having flexible plans, backcountry enthusiasts can plan enjoyable, safe outings.
Mt Islip, near the PCT, burned in the Bobcat Fire (2020) (Kenny Meyer)
In July, 2018, 17 major fires burned across California, with additional fires in Oregon, Washington, British Columbia and Colorado. Unlike summer fires in the past, they seemed to explode in size and number, increasing significantly every day that they burned. These fires generated tremendous plumes of smoke that spread across the west. In July and August, it didn’t seem like there were any wildlands where one could find clean air other than the coastal areas.
To illustrate the size and scope of just a few of these fires, here are some stats. The Ferguson Fire near Yosemite started on July 13, 2018, burning 96,901 acres. Parts of Yosemite were evacuated and Yosemite Valley closed from July 25 to August 10. To illustrate how fast it grew, it spread to 828 acres in just the first 24 hours. The Carr Fire near Redding, which started on July 23, 2018, ultimately burned 229,651 acres and 1,079 residences. The Mendocino Complex Fire started July 27, 2018, finally burning 459,123 acres. Within the first 24 hours, it burned 42,017 acres. The Donnell Fire near Sonora Pass started August 1, 2018 and burned 36,450 acres.
Fall wasn’t much better in 2018 with the disastrous Camp Fire in Paradise that burned more than 150,000 forested acres and 18,000 buildings. At its peak, it raged forward at an acre per second. Tragically, more than 80 bodies were recovered. This fire broke all kinds of records and was notable for how late in the season it was. It started on November 8 with a foehn wind blowing from the east, well after our winter rains should have started. Hikers heading into the wilderness in autumn are advised to be aware of the potential danger of being caught in such a firestorm, especially during red flag warnings.
The 2018 California wildfire season was so bad that it has its own Wikipedia entry. A total of 8,527 fires burned 1,893,913 acres. On August 4, a national disaster was declared in Northern California.
The 2020 California Wildfire Season was another record setting wildfire year with 9,639 fires burning 4,397,809 acres in California (4% of California’s land mass). There were a few notable highlights, including a rare ban on ALL stoves in the backcountry (anything that ignited) in ALL national forests in California in the fall. The Glass Fire in Napa and Sonoma was notable for it’s speed, flaring up from 20 acres to 11,000 acres in one day.
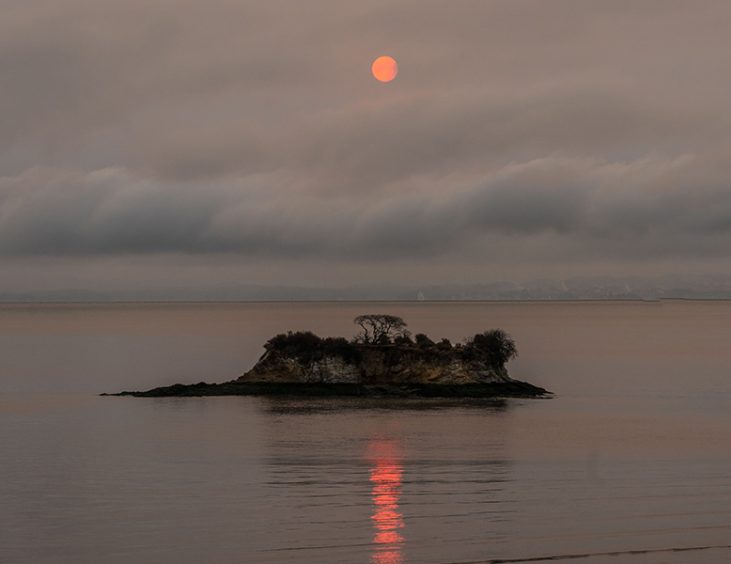
China Camp, Sunrise Nov. 9, 2018 Camp Fire (Steve Ziman)
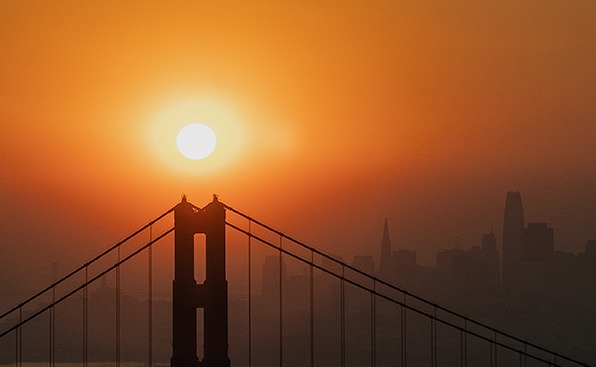
Golden Gate Bridge Sunrise on Nov. 11, Camp Fire (Steve Ziman)
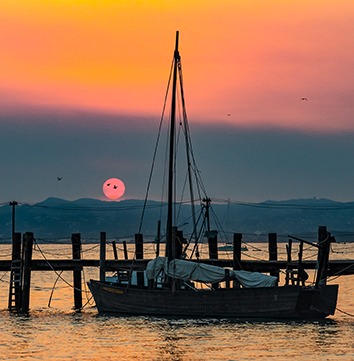
Rat Rock Sunrise, Aug. 7, 2018 (Steve Ziman)
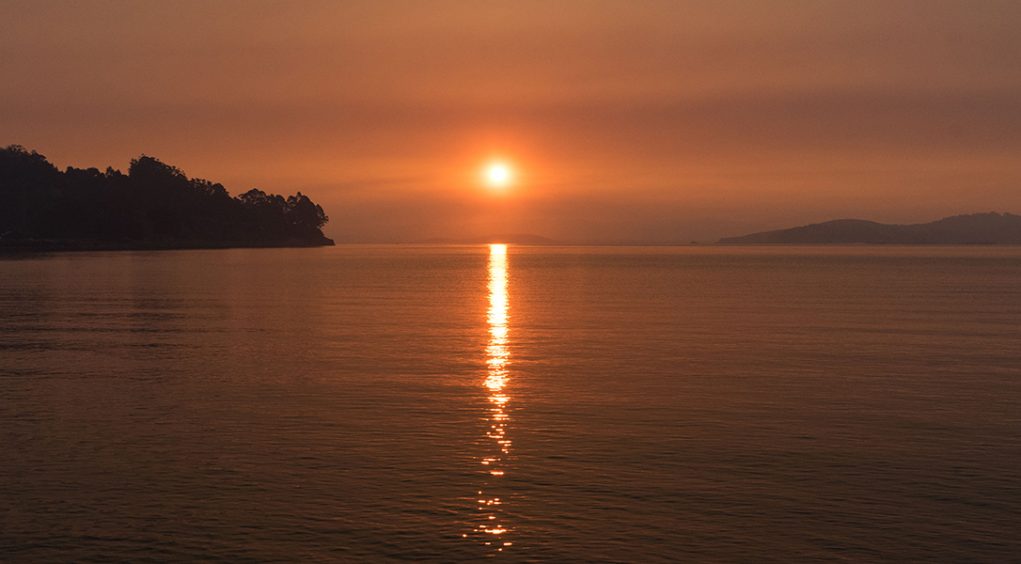
Sunrise San Pablo Bay, Tubbs Fire Oct 12, 2017 (Steve Ziman)
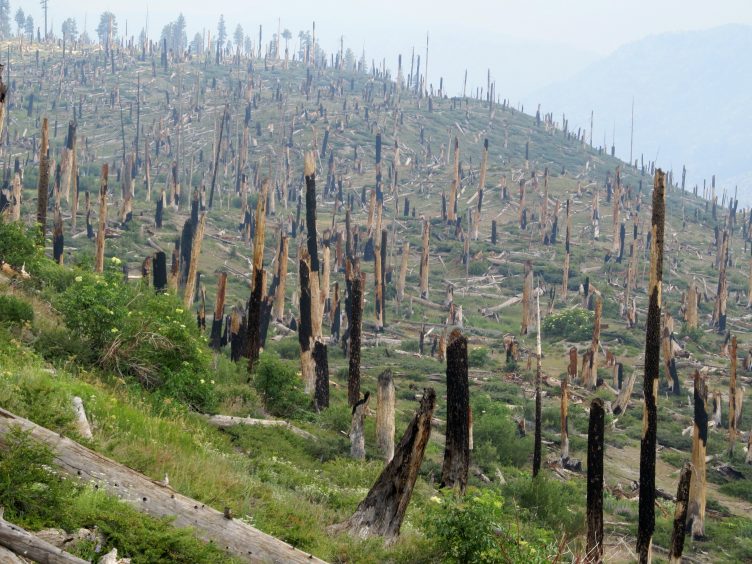
Burn from the Rainbow Fire (1992) near Red’s Meadow through smoke from the French Fire (2014) on the John Muir Trail